The Food Cost Comparison report offers visibility into all of your stores’ food cost numbers in a single report. Compare “Actual Food Cost”, “Ideal Food Cost”, “Variance Food Cost”, and “Transfers” across your stores to identify problem areas and/or top performers.
Accessing Food Cost Comparison
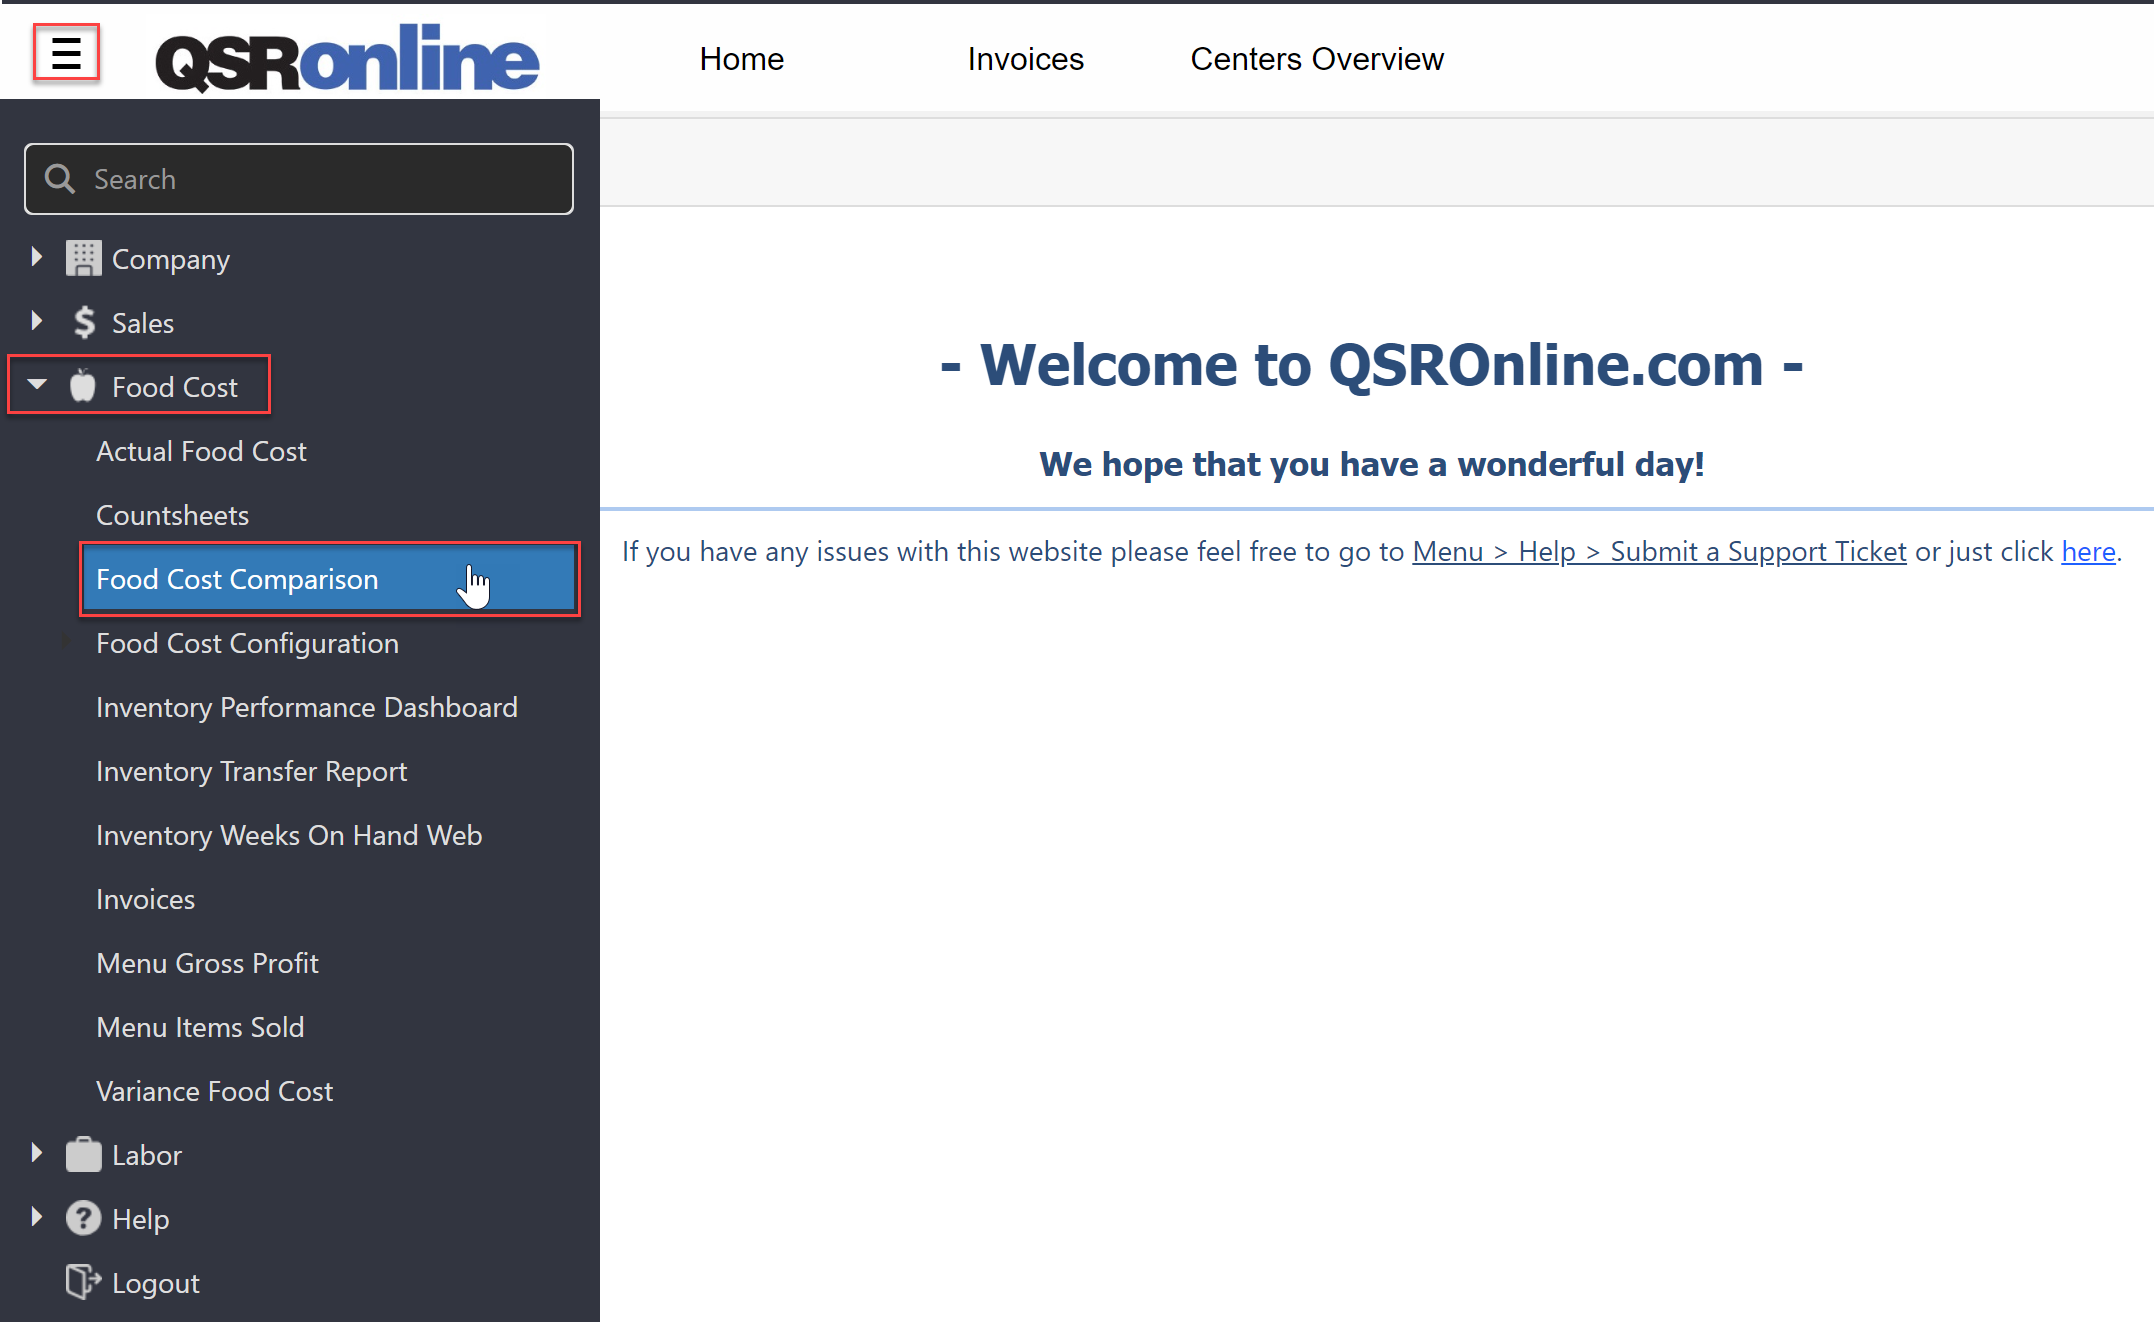
To access the Food Cost Comparison, select the Menu > Food Cost > Food Cost Comparison.
Food Cost Comparison Options
- Select Unit(s): The Food Cost Comparison automatically defaults to the user’s highest level unit access.
- Count Type: Allows you to select which countsheet type you want to use to populate the data within the dashboard.
- Monthly
- Weekly
- Daily
- Shift
- Date Range: Allows you to select a specific date range to run the dashboard. Please keep in mind that you want to use a date range that correlates with the selected “Count Type”.
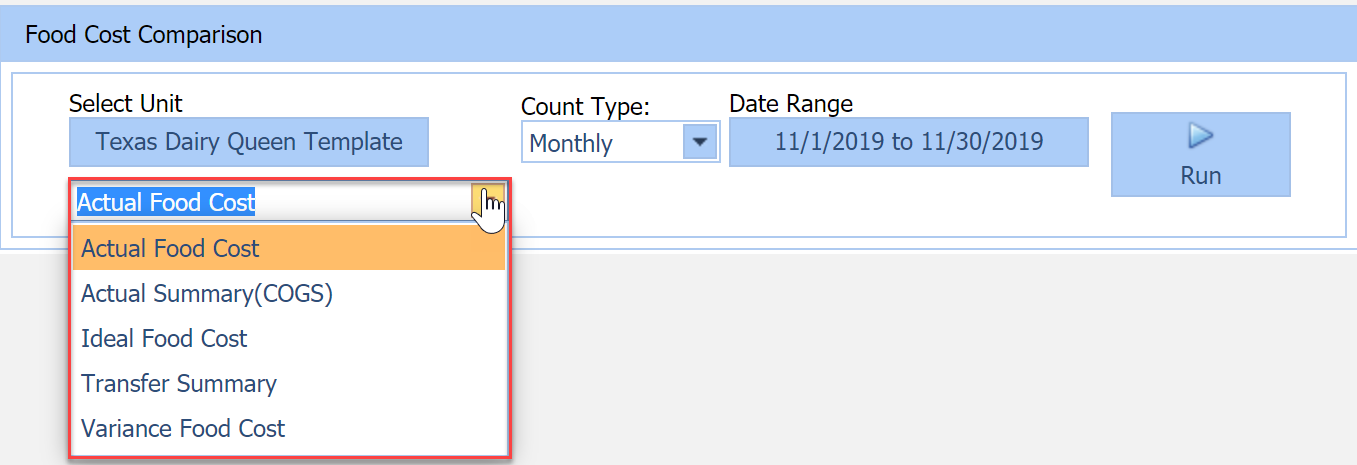
- Report Selection: This drop down allows you to select which report to use for comparison.
- Actual Food Cost
- Actual Summary (COGS)
- Ideal Food Cost
- Transfer Summary
- Variance Food Cost
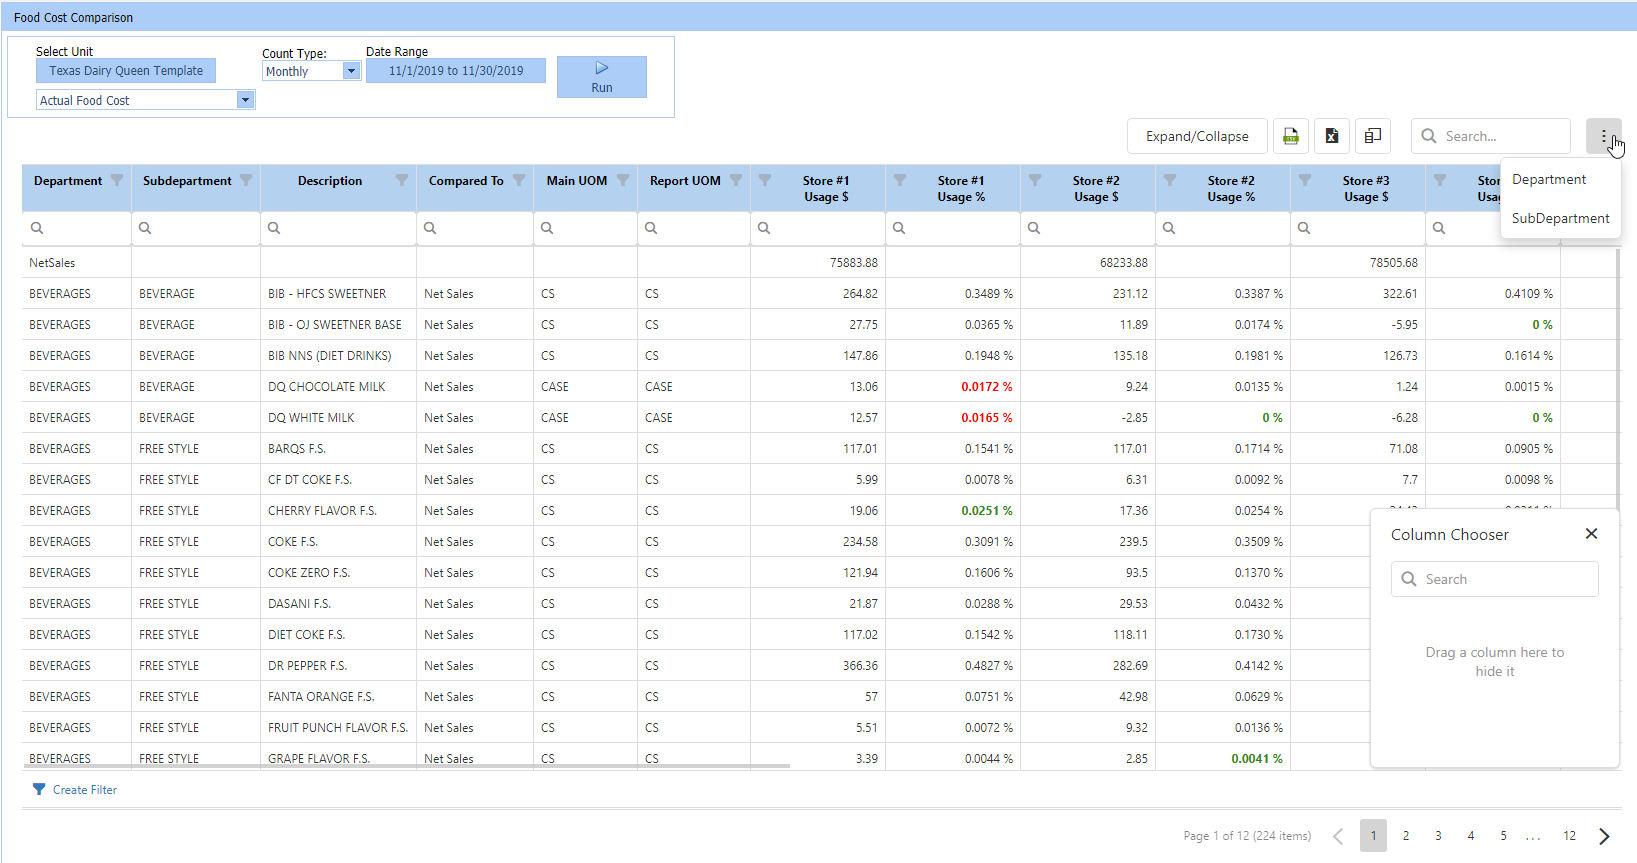
- Expand/Collapse: Allows you to expand/collapse the “Department/SubDepartment” groupings if the option to show them is selected.
- Export All Raw Data: Exports the report into a .CSV file format.
- Export All Data: Exports the report into an .XLSX file format.
- Column Chooser: Allows you to remove/add columns by dragging columns from/to the “Column Chooser”.
- Column Filters: Allows you to filter the data within each column.
- Column Search: Allows you to filter the data by column using specific keywords and/or parameters.
- Column Search Parameters:
- Contains
- Does not contain
- Starts with
- Ends with
- Equals
- Does not equal
- Reset
- Column Headers: Right Clicking any “Column Header” gives you the ability to change the sorting within a column, “Group By” the selected column, and/or “Fix/Unfix” the selected column to the left or right of the report.
-
- Sort Ascending
- Sort Descending
- Group by This Column
- Fix
- To the left
- To the right
- Unfix
- Group By: Adds collapsible rows that allow you to group the report by “Department” & “SubDepartment”.
- Department
- SubDepartment
Report Selection
- Actual Food Cost: displays actual “Usage $” and “Usage %”.
- Actual Summary (COGS): displays “Qty of Main” and “Report UOM” (Unit of Measure), “Usage $”, and “Usage %”.
- Ideal Food Cost: displays “Ideal Cost $” and “Ideal Cost %”.
- Transfer Summary: displays “IN $”, “OUT $”, and “Total $” for transfers.
- Variance Food Cost: displays “Variance $” and “Variance %”.
Customizing the Food Cost Comparison
“Column Chooser” allows you to add/remove columns from the grid by selecting a column and dragging them from/to the “Column Chooser”.
Each report will have different “Column Options”, so when adding/removing columns from one report type, your changes do not transfer to any other report type.
Rearrange the columns within the report by selecting the “Column Header” and dragging/dropping into the desired order.
The “Group By” option allows you to add/remove collapsible rows to the report for “Department & SubDepartment” grouping.
The “Expand/Collapse” selection will only function when you have the “Department” & “SubDepartment” groupings selected.
Right Clicking the “Column Headers” gives you the ability to change the sorting within a column, “Group By” the selected column, and/or “Fix/Unfix” the selected column to the left or right of the report.
Running the Food Cost Comparison
To run the Food Cost Comparison, select your “Unit(s)”, “Date Range”, “Count Type”, and “Report Selection”, then select “Run”.
(Please keep in mind that you want to use a “Date/Date Range” that correlates with the selected “Count Type”.)
Once the selected report generates, you can search and filter columns to compare data across your units for specific items and using specific parameters.