The Variance Food Cost Report is an excellent way to view a snapshot of your variance food cost across departments and sub-departments, helping to identify potential problems, such as excess waste, theft, counting issues, or improper portion control.
Accessing the Report
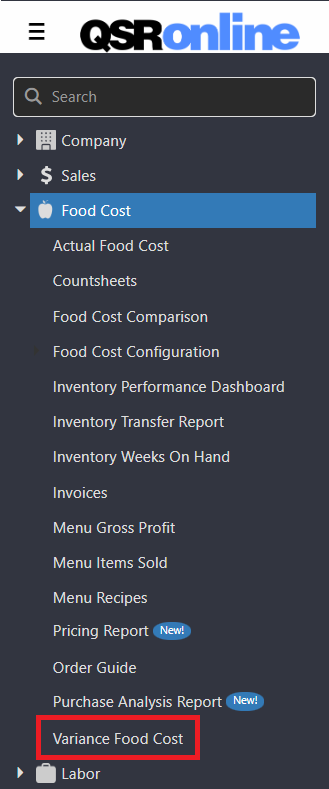
To access the Variance Food Cost Report:
- Click on the Menu icon in the top left corner.
- Click on Food Cost.
- Select Variance Food Cost.
Viewing the Report
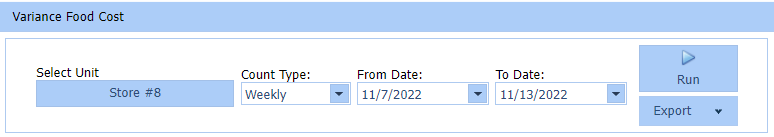
- Select the appropriate unit.
- Select the count sheet type you wish to use to populate this report. Types include shift, daily, weekly, or monthly.
- Choose the date range from and to dates. Please note: the “To Date” will always be one day prior to the date of the ending count sheet.
- After making your selections, click Run to populate your report.
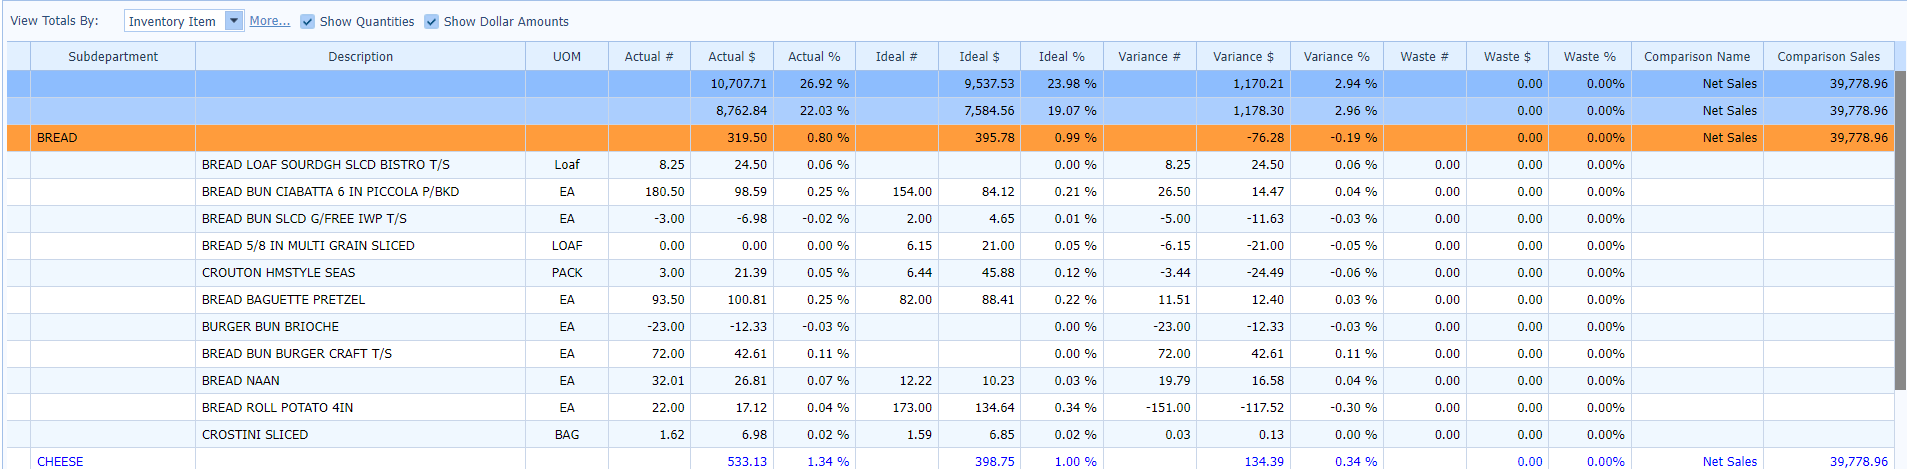
Variance Food Cost Detail
Variance Food Cost refers to the differences between your Actual Food Cost (based on invoices and count sheets) and your Ideal Food Cost (based on product mix and recipes). The Variance Food Cost Detail compares the Actual Food Cost to the Ideal Food Cost for each inventory item to show you any loss or gain in product.
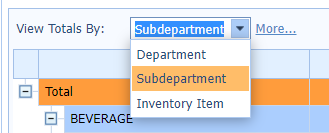
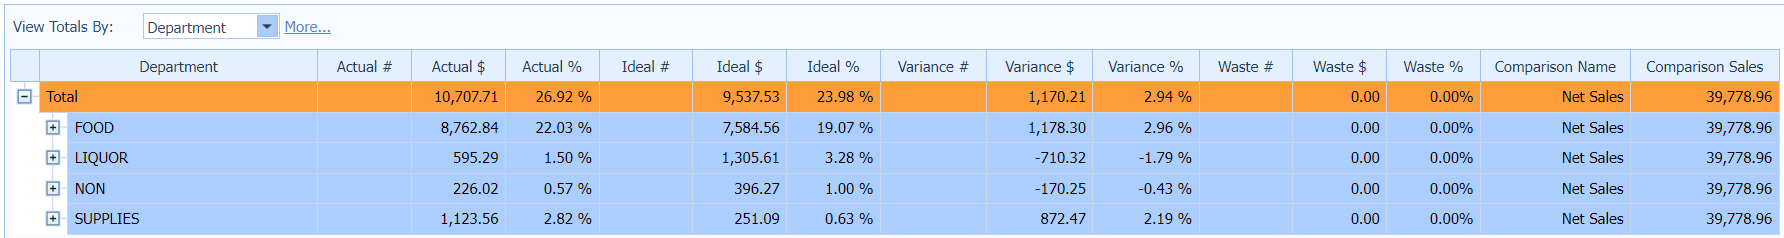
View Totals By
You can easily view the details by the Department, Sub-department, or Inventory Item level.
More… Hyperlink Options
To the right of the View Totals By dropdown, you’ll find a hyperlink with page shortcuts.
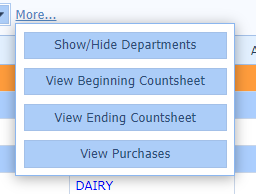
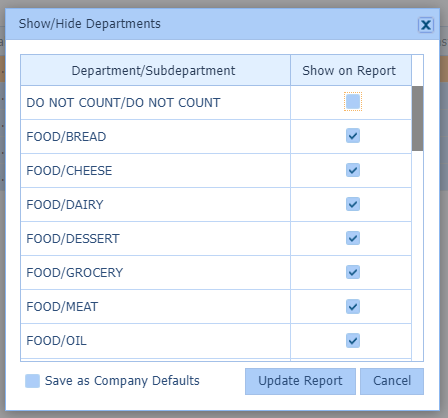
Show/Hide Departments
You can select which Departments and Sub-departments are displayed on the selected report. Click update report.
View Beginning Count Sheet, View Ending Count Sheet, and View Purchases
These are shortcut keys to allow quick access to the count sheets and the Purchase Analysis Report in the event that you need to troubleshoot. Clicking on a button will open a new page so you can easily toggle between.
- View Beginning Count sheet will open the beginning count sheet used in the Actual Food Cost calculations.
- View Ending Count sheet will open the ending count sheet used in the Actual Food Cost calculations.
- View Purchases will pull up the Purchase Analysis Report, which displays all invoiced purchases received during the date range selected for the Variance Food Cost Report.
Interpreting the Variance Food Cost Report
To see detailed information pertaining to each grouping, simply click the + sign to the left of the desired Department or Sub-department within the Variance Food Cost Report.
Column Headers
Along the top of the report are columns that break down each component of the report. You can click on each column independently to sort details by ascending or descending order.
- Department – The departments within your inventory.
- Sub-department – The sub-departments within your inventory.
- Description – The names of your inventory items.
- UOM – Refers to the reporting unit of measure that was selected to view usage within food cost reporting (this selection can be changed within the Inventory Item window, for more instructions please view the guide for Food Cost Configuration – Configure Inventory – Inventory Items Tab).
- Actual # – The quantity of product used.
- Actual $ – The value of product used based on purchases.
- Actual % – The value of the product used divided by the net sales (default comparison value).
- Ideal # – The theoretical quantity of the product used calculated from recipes.
- Ideal $ – The theoretical value of the product used calculated from recipes and purchases.
- Ideal % – The theoretical value of the product used divided by the net sales (default comparison value).
- Variance # – The calculated difference between the Actual # and the Ideal #.
- Variance $ – The calculated difference between the Actual $ and the Ideal $.
- Variance % – The calculated difference between the Actual % and the Ideal %.
- Waste # – The quantity of product added to Waste Count Sheets. (NOTE: This quantity is for reference only, this total is not depleted from the Actual #)
- Waste $ – The value of product added to Waste Count Sheets. (NOTE: This quantity is for reference only, this total is not depleted from the Actual $)
- Waste % – The value of the wasted product used divided by the net sales (default comparison value). (NOTE: This quantity is for reference only, this total is not depleted from the Actual %)
- Comparison Name – Refers to the comparison metric (by default the net sales comparison is used).
- Comparison Sales – The value of the sales for the Comparison Name (by default the net sales comparison is used).
Food Cost Breakdown
The Food Cost Breakdown Report gives you an in-depth breakdown of the selected inventory item by the reporting unit of measure. Simply double-click on the inventory item within the Variance Food Cost Detail Report. A tri-colored breakdown will appear showing the Actual, Ideal, and Variance Food Cost.
Once you have identified the highest variance inventory items, you can double-click the inventory line item for a Food Cost Breakdown.
Here you will get a detailed breakdown of your actual, ideal, and variance details.
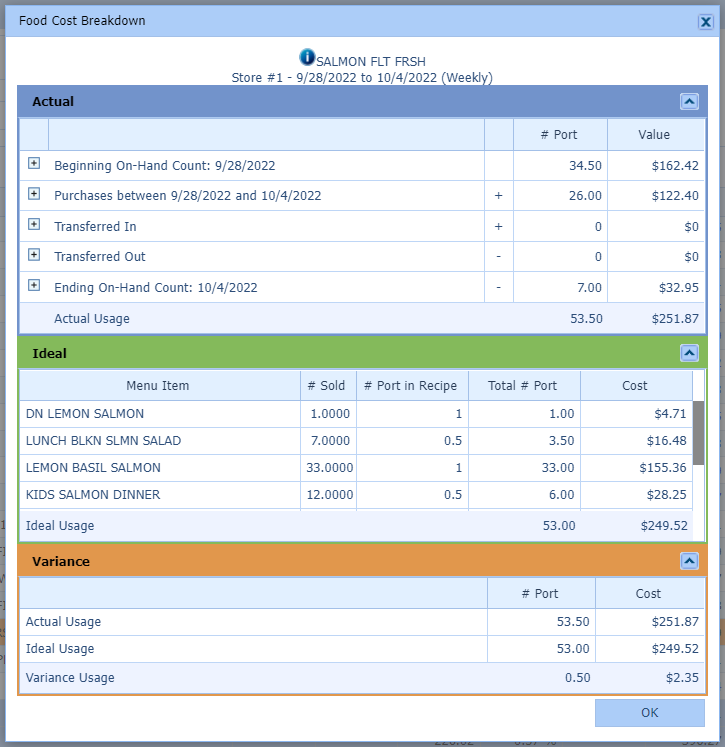
The Actual section shows how the Actual Food Cost is calculated for the selected item.
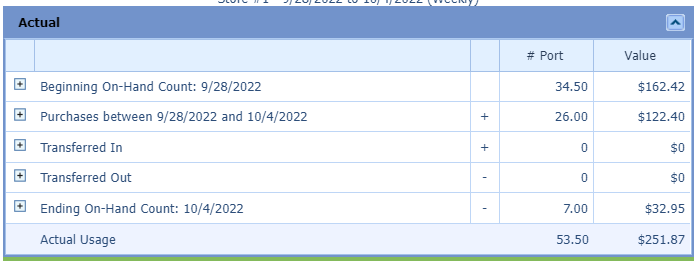
- Beginning On-Hand Count – The # and value of the selected inventory item counted in the beginning count sheets.
- Purchases – The # and value of the selected inventory item purchased between the beginning and ending count sheets.
- Transferred In – The # and value of the selected inventory item transferred to another location between the beginning and ending count sheets.
- Transferred Out – The # and value of the selected inventory item transferred to your location between the beginning and ending count sheets.
- Ending On-Hand Count – The # and value of the selected inventory item counted in the ending count sheets.
- Actual Usage – The calculated # and value of the selected inventory item used within the reporting period.
Ideal shows how the Ideal Food Cost is being built for the selected inventory item by displaying each Menu Item that contains the selected inventory item and the quantity going into the recipe.
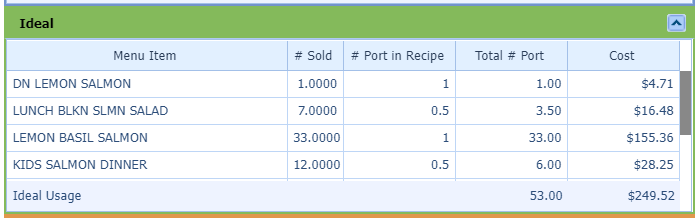
- Menu Item – The menu item(s) that contain the selected inventory item in the recipe.
- # Sold – The quantity sold of each menu item (based on the Menu Items Sold report in QSR)
- # UOM in Recipe – The quantity of the selected inventory item in the recipe for the menu item.
- Total # UOM – The total quantity of the selected inventory item in the recipe multiplied by the # Sold.
- Cost – The value of the selected inventory item used in the recipe.
- Ideal Usage – The calculated totals of the Total # UOM and the Cost.
Variance will show the difference between the Actual and Ideal Food Cost.
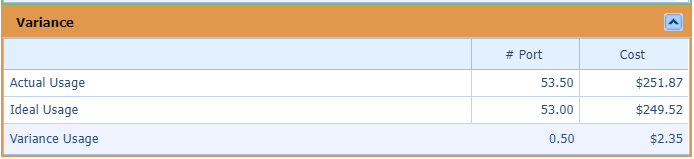
- Actual Usage – The calculated totals of the Total # UOM and the Cost from the Actual section.
- Ideal Usage – The calculated totals of the Total # UOM and the Cost from the Ideal section.
- Variance Usage – The calculated totals of the Total # UOM and the Cost derived from subtracting the Ideal Usage from the Actual Usage.
Troubleshooting Variance Food Cost
For best results, we suggest running the Actual Food Cost report directly after counts to catch possible miscounts and missing purchases. Ensuring accurate actual usage is the first step to troubleshooting food cost issues.
Once you have run the Variance Food Cost report for the desired count sheet type and range you can use the tools and options that we have gone over in the Variance Food Cost Detail and the Interpreting the Variance Food Cost sections.
Potential Causes for Variance Issues
I=A – This is coding that can be added to for inventory items that are hard to track accurate usage for. This coding calculates 0% variances for inventory items. Please contact QSR to assist you with adding this coding. Reasons for using I=A:
- The desired inventory item cannot be accurately counted
- Spices, herbs, and seasonings may be difficult to count accurately
- The desired inventory item cannot be accurately added to recipes
High Variances – The actual use is more than what your ideal usage has calculated. Things to check:
- Are all purchases accounted for?
- Missing transfers to another location
- Was the product counted properly?
- Miscounts
- Missing counts from the beginning count sheet
- Not tracking/counting Prep Items
- Waste
- Do the recipe quantities look correct?
- The recipe may require adjustments
- Is the correct quantity being used in production?
- If items are not being pre-portioned or portioned using a tool such as a spoodle or a scale this could be contributing to an issue of over-portioning
- Is the mapping correct?
- The vendor item may not be mapped properly
- A substitution may not have been mapped to the main inventory item
- A substitution may have been mapped to a new inventory item and an equivalency was not set
Negative Variance Usage – The actual use is less than what your ideal usage has calculated. Things to check:
- Are all purchases accounted for?
- Missing invoices
- Missing transfers from another location
- Was the product counted properly?
- Miscounts
- Missing counts from the ending count sheet
- Do the recipe quantities look correct?
- The recipe may require adjustments
- Is the correct quantity being used in production?
- If items are not being pre-portioned or portioned using a tool such as a spoodle or a scale this could be contributing to an issue of under-portioning
- Is the mapping correct?
- The vendor item may not be mapped properly
- A substitution may not have been mapped to the main inventory item
- A substitution may have been mapped to a new inventory item and an equivalency was not set
If these questions have been answered satisfactorily and you are still seeing an issue it may be helpful to add the inventory item to a daily critical count. This will help better track that counting has been completed properly. You may also decide to observe portioning during production.
If you have ruled out all internal possibilities, please reach out to our dedicated Help Desk team for further assistance.