The “Menu Gross Profit” report provides you with gross profit dollars and percentages for each Menu Item based on the “Menu Item Price”, “Recipe Cost”. and “Item Sales”. The “Menu Gross Profit” report allows you drill down and view details to determine if the menu item is doing well at the current price or if adjustments need to be made to the item price or recipe to ensure you are hitting profit goals.
Accessing the Menu Gross Profit Report

To access the Menu Gross Profit, select the Menu > Food Cost > Menu Gross Profit.
Menu Gross Profit Report Options
Select Unit: Allows you to select a specific “Unit” or “Area” to view the report for.
Date Range: Allows you to select a specific “Date” or “Date Range” to run the report for.
Show Items With Sale of $0: Displays menu items with zero sales for the selected “Date Range”. This includes menu items with an item price of $0.00.
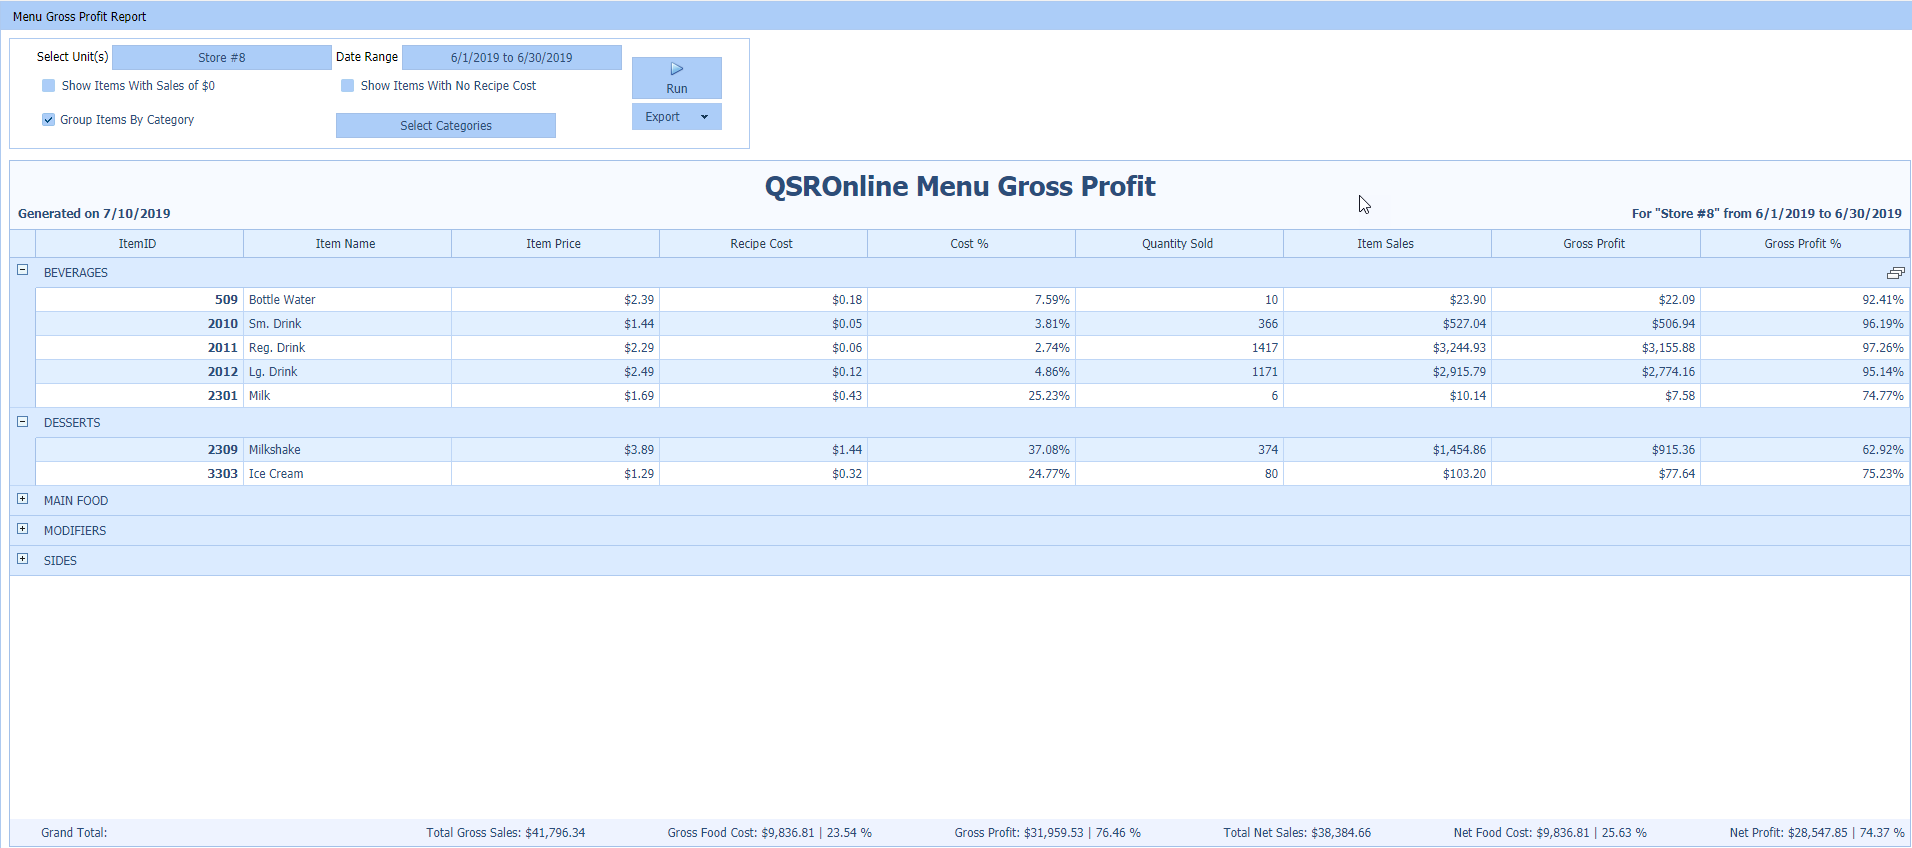
Group Items By Category: Displays menu items grouped by the “Category Classification” that is being pulled from the “POS System”. This option is automatically selected by default.
Show Items With No Recipe Cost: Displays menu items that do not have a recipe.
Select Categories: Allows you to select specific “Categories” to view the within the report.
Export: Allows you to export the report in an “Excel” or “PDF” format.
Generating the Menu Gross Profit Report
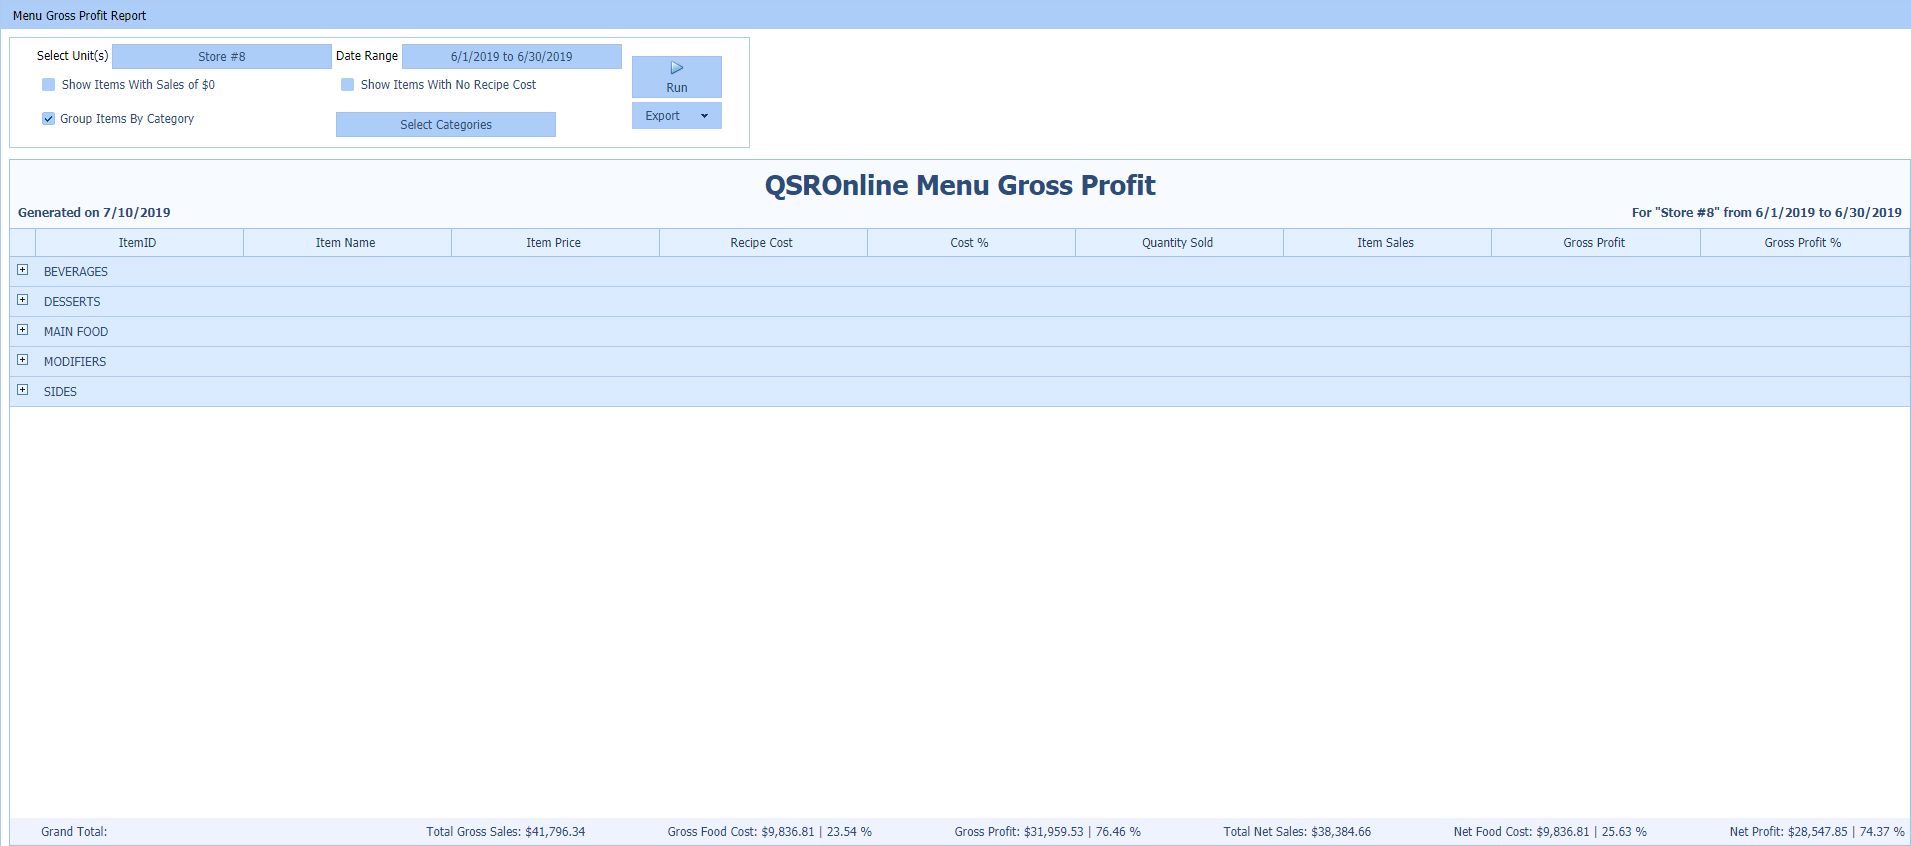
Before generating the “Menu Gross Profit” report, select the “Unit”, “Date Range”, and “Options” you would like to view on the report.
Menu Gross Profit Report Columns
Columns and Headers
Below is a glossary of “Column Headers” within the “Menu Gross Profit” Report. Clicking any “Column Header” will re-sort the data within the report by the selected column in ascending order. Clicking the “Column Header” again will re-sort the report in descending order.
Item ID: The “Menu Item ID” that is being pulled from the “POS System”.
Item Name: The “Menu Item Name” that is being pulled for the “POS System”.
Item Price: The “Menu Item Price”.
Recipe Cost: The total cost of menu item based of the recipe entered into QSROnline.
Cost %: The “Food Cost %” of the menu item.
Quantity Sold: The “Quantity” of the menu item sold for the selected “Date Range”.
Item Sales: The “Total Sales” of the menu item for the selected “Date Range”.
Gross Profit: The “Total Gross Profit” of the menu item for the selected “Date Range”.
Gross Profit %: The “Total Gross Profit Percentage” of the menu item for the selected “Date Range”.
Grand Total Row
At the bottom of the “Menu Gross Profit” Report, you will find the “Grand Total” row. Below is a brief description of the data displayed within the “Grand Total” row.
Total Gross Sales: The “Total Gross Sales” for the selected “Date Range”.
Gross Food Cost: The “Total Food Cost Percentage” based off of “Gross Sales” for the selected “Date Range”.
Gross Profit: The “Total Gross Profit Dollars and Percentage” based off of “Gross Sales”.
Total Net Sales: The “Total Net Sales” for the selected “Date Range”.
Net Food Cost: The “Total Food Cost Percentage” based off of “Net Sales” for the selected “Date Range”.
Net Profit: The “Total Profit Dollars and Percentage” based off of “Net Sales”.
Reading the Menu Gross Profit Report

In the example above, the “Chipotle Burger” is priced at $5.99, but it only costs $1.62 to make which gives this menu item a 27.12% food cost. This means that 27.12% of the sales for this item goes to making the item and the other 72.88% is profit made. Since this item runs a lower food cost percentage, you may want to promote this item to boost sales.
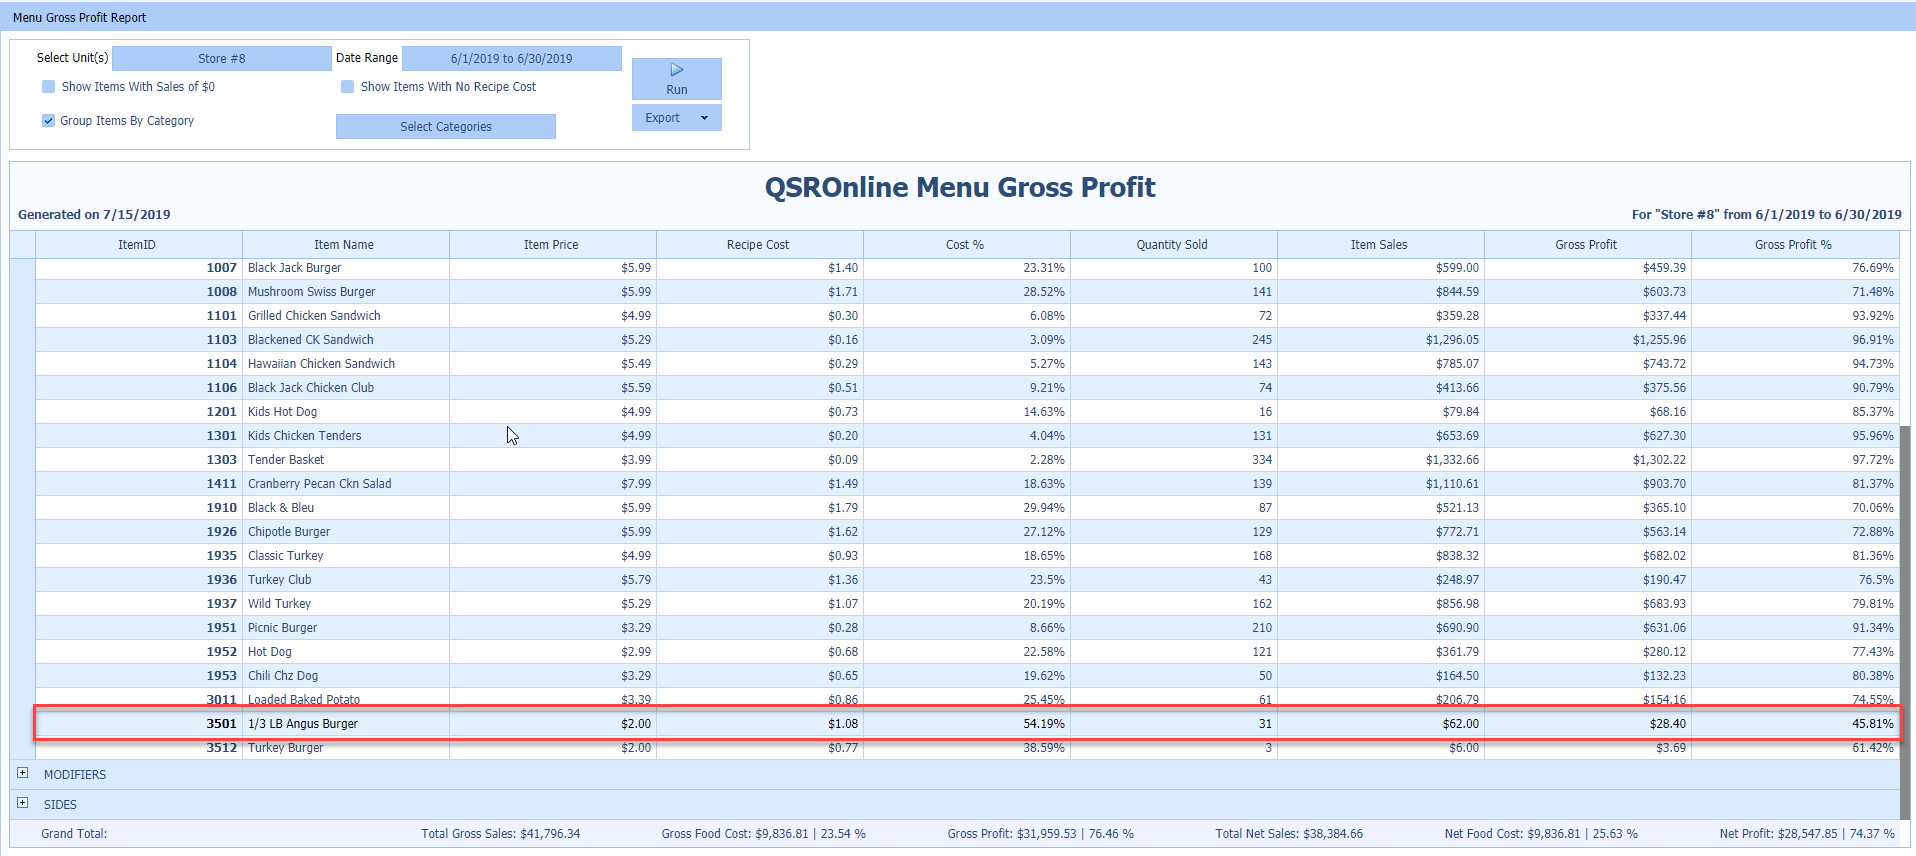
In the example above, the “1/3 LB Angus Burger” is priced at $2.00, but costs $1.08 to make, which gives this menu item a 54.19% food cost. This means that 54.19% of the sales for this item goes to making the item and the other 45.81% is profit. Since this item runs a higher food cost percentage, you may want to look into raising the item’s menu price.