Our reports put all of your critical labor numbers in front of you in one, easily accessible place. Labor reports can be accessed within the Scheduler under the View Reports tab. Use the drop-down next to report to view different reports. You may view labor reports for different work weeks, but most of them, excluding the Labor Matrix Tool, is most beneficial to analyze after the week presented the report has passed. This is so because all of your actual data will be present on the report, providing you with better insight.
Previous Article
View Posting the Schedule
Labor Analysis Report
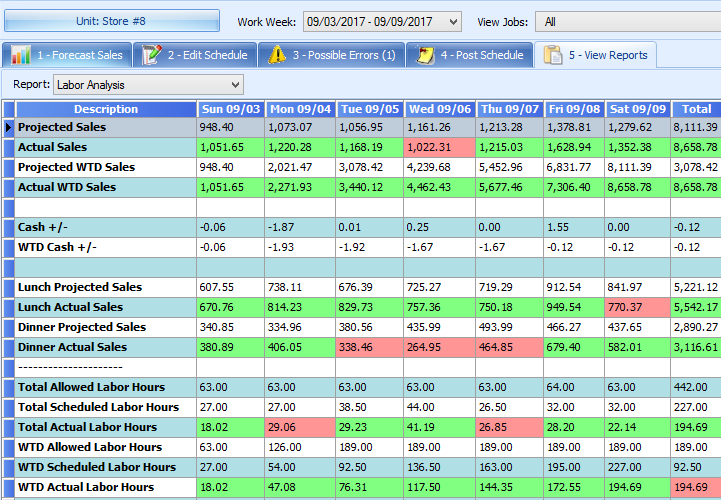
The Labor Analysis Report compare your actual and projected sales to your actual and projected labor. Actual sales higher than those projected are depicted in green, and actual sales lesser than projected are shown in red. The opposite is true for labor. Actual labor higher than projected is highlighted in red because higher labor hours results in a higher labor cost. Actual labor less than projected labor is shown in green because you are spending less on labor than expected.
This report displays your day-part sales and day-part labor hours. This report is an excellent way to determine whether or not managers are making proper labor adjustments to meet their labor goals.
Labor Matrix Tool

The Labor Matrix is a great tool for adjusting your labor throughout the day when actual sales are behind projected sales.
1. View your Average Pay Rate for scheduled employees, your Total Projected Sales, Scheduled Labor Goal %, and Scheduled Labor Hours. *Please note that the average pay rate and projected sales figures come from your POS system.
HOW TO USE THE LABOR MATRIX:
According to the Labor Matrix, at 1 PM, sales should be $474 (based on your total projected sales for the entire day). In the event that actual sales are $200 behind $474 at 1 PM, you would go over to the column titled $200 (highlighted in red) and go down to the Noon row (also highlighted in red). Where the column and row meet (bolded in red) represents the number of labor hours that should be cut in order to meet your Scheduled Labor Goal.
In this example: if at 1 PM, sales were behind by $200, you should cut 14.55 labor hours to meet your Scheduled Labor Goal %.
In this example: If at noon, sales were behind by $200, you should cut 14.93 labor hours to meet your Scheduled Labor Goal %.
Clock-In Clock-Out Exceptions Report
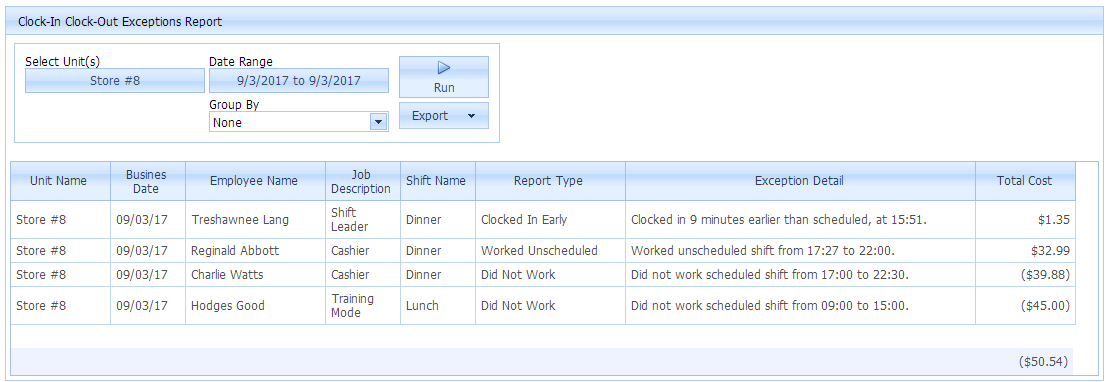
The Clock-In Clock-Out Exceptions Report lists each employee who failed to work scheduled hours, worked unscheduled hours, clocked in early, or clocked out late.
1. Ultimately, this report displays your total cost in EXTRA labor dollars due to employees working unscheduled hours, clocking in early, and clocking out late.
Scheduled vs. Actual Report
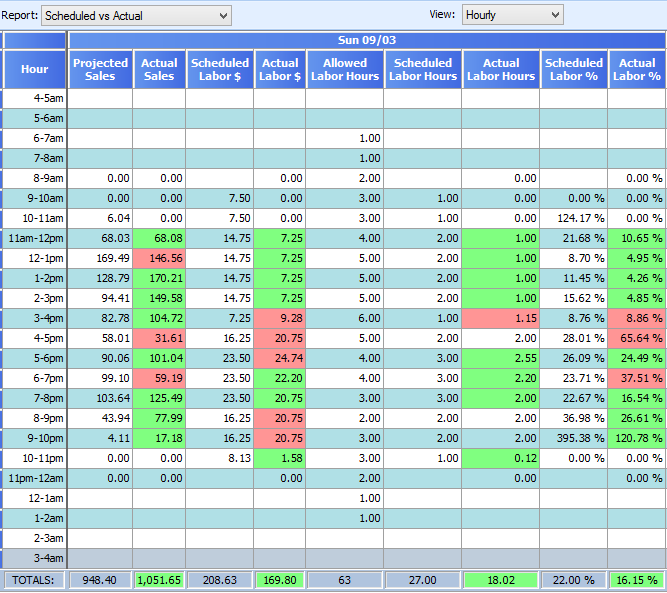
This report breaks down your actual and projected labor and your actual and projected sales for each day of the selected week. This report is a great way to identify negative scheduling trends. For example, if you notice that each day actual labor hours are greater than projected, it could signify a manager allowing employees to work extra hours. It could also signify a manager under scheduling employees, resulting in employees having to work more hours than they’re scheduled in order to meet customer demands.
The color-coding in the Scheduled vs. Actual Report is the same as the color-doing in the Labor Analysis Report:
Actual sales higher than those projected are depicted in green, and actual sales lesser than projected are shown in red. The opposite is true for labor. Actual labor higher than projected is highlighted in red because higher labor hours results in a higher labor cost. Actual labor less than projected labor is shown in green because you are spending less on labor than expected.


