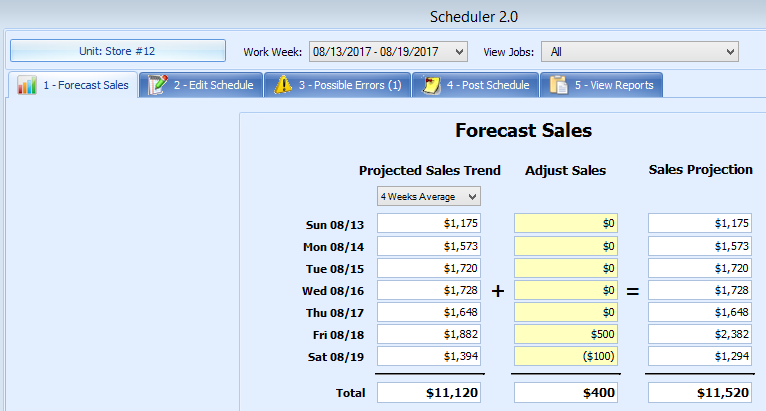
Sales projections, which are based on historical sales, are populated for you from your POS sales data. Knowing your expected sales allows you to create a schedule of employees that meet your labor goals and covers the expected sales volume. A 4 week average may be a great sales trend to use except for holidays where the last year sales provide a more accurate view of expected sales. To see more on the Sales Trend Settings review the Administrator Settings Guide.
Previous Article
View Getting Started in Scheduler 2.0
Sales Forecast
The first tab is the Forecast Sales tab. Choose the work week for the schedule that you would like to create. If you have access to more than one location you can select the location with the Unit Tab.
Underneath the Projected Sales Trend the trend chosen to show by default is displayed. Admins can set the set trend and allow users to change if needed. For more details on these options please review the Administrator Settings.
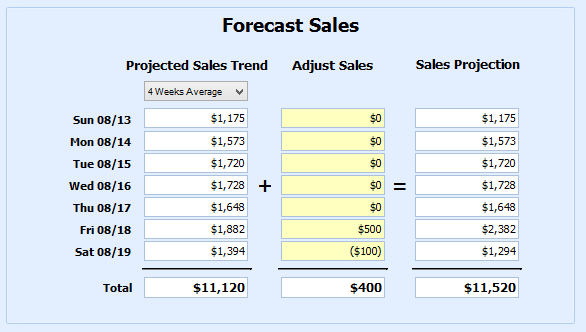
In this example, the sales shown are the average sales for the last 4 weeks for each specific day. Your total projected sales for the given week are $11,120.
Adjusting Sales
The yellow column to Adjust Sales is available if you are aware than sales will be different than the trend.Simply key in the adjustments. For negative adjustments, key in the “-” sign before keying in the numbers, and parentheses will appear letting you know that the figure is negative. Your adjusted amount will appear at the bottom of the column in the Total row. Your Sales Projection Total will also adjust according to your adjusted sales.
After making adjustments the Sales Projection now shows 11,520 in sales. Click the Next: Edit Schedule button.


