Objective
View your QSROnline Reports anytime, anywhere! Log in and immediately get a quick recap of Net Sales, Labor Percentages, Transaction Numbers, and Cash+/- across stores.
How to download the Reporting app
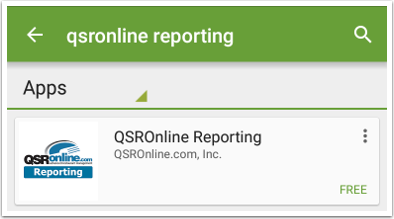
Go to the Google Play Store or open the Play Store in Apps. Search for QSROnline. Click to install the QSROnline Reporting app. Follow the on-screen instructions.
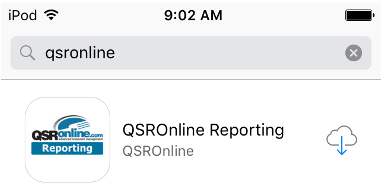
Go to the App Store. Search for QSROnline. Click install on the QSROnline Reporting app. Follow the on-screen instructions.
How to Login
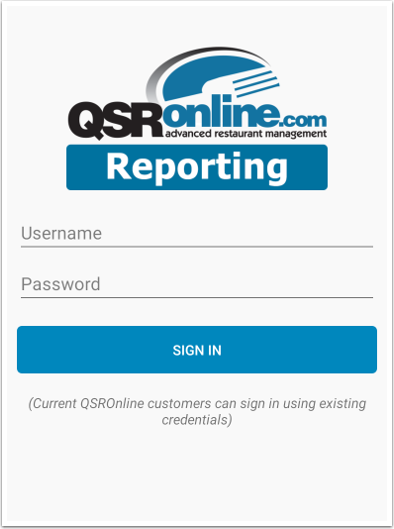
Once installed, enter your QSROnline Username and Password into the required fields.
Features
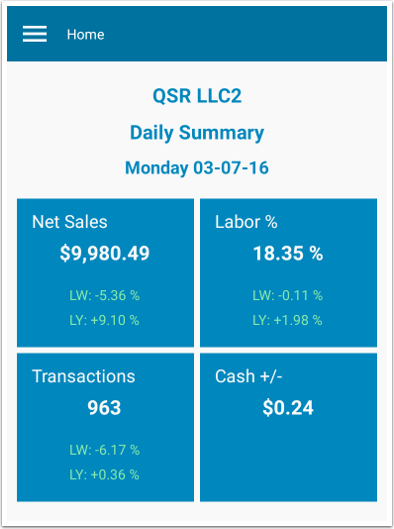
On the Home Page, the dashboard view has a summary for the area in which you have been given access to by your company’s QSR Administrator. To get details for a specific location, click on one of the four tiles.
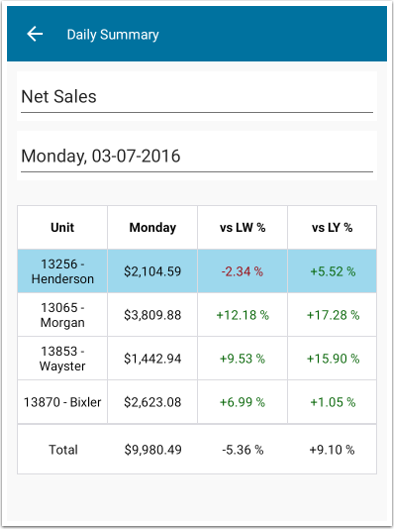
Summary Detail Page

Category and date drop down controls are provided to switch to different summary detail view and dates.
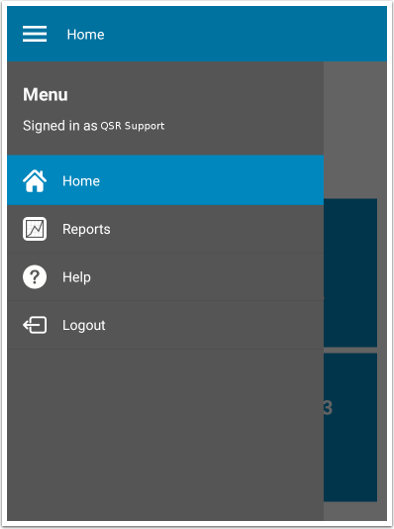
Menu Page
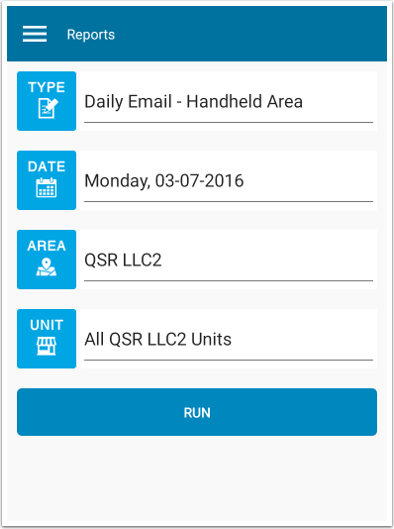
Reports
Select the report criteria and click Run.
Top Emailed Report Subscriptions
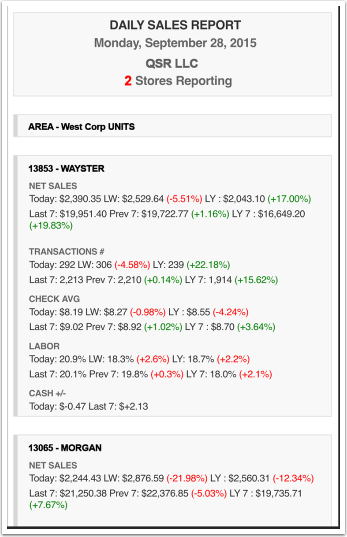
Daily Email – Handheld Area
- The Daily Email-Handheld Area Report offers a snapshot of your most crucial numbers, including labor percentages, net sales, cash +/-, check averages, and transactions. In addition, the report compares the current day’s numbers to those of last week’s and last year’s.
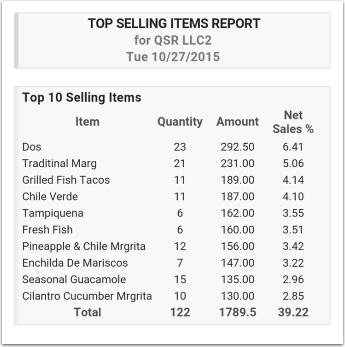
Top Selling Menu Items – By Sales $
- The Top Selling Menu Items Report lists your top selling menu items, along with quantities sold and revenue earned. With this report, managers can easily decipher which items should are most popular and which items should be promoted to customers.
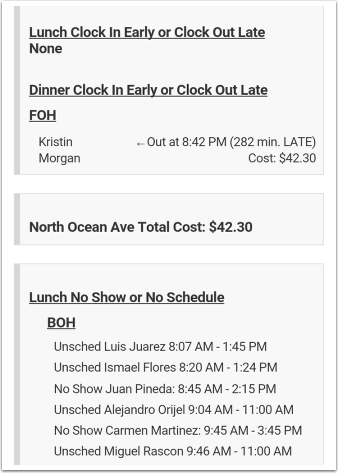
Clock In Clock Out Exceptions Report
- The Clock In Clock Out Exceptions Report compares your actual sales and labor to your projected sales and labor. Actual sales figures higher than projected sales are highlighted in green. Actual sales lower than projected sales are highlighted in red. On the contrary, actual labor higher than projected labor is highlighted in red while actual labor lower than projected labor will be highlighted in green.
In addition, this report will list those employees who failed to show up for work.
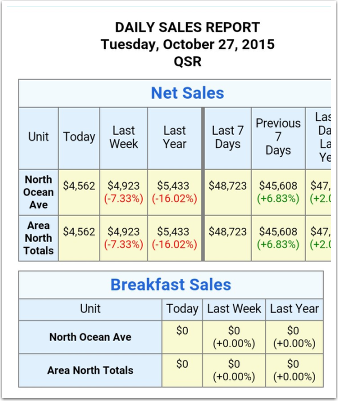
Daily Email – Unit Comparison
- View your daily sales, day-part sales, transactions, and labor dollars across units in a quick, easy-to-read summary. The image will easily move about your screen to display all of the data with the touch of a finger.
Troubleshooting
Why are my sales showing $0?
- The unit may be missing sales for the selected day. Please reach out to our data verification team at 877-334-6640.
Why do I not have access to all units in my company?
- Depending on your security level, your assigned role may only have access to the select unit(s). Please reach out to your company Admin for further assistance.