QSROnline reports put all of your critical labor numbers in front of you in one, easily accessible place. Labor reports can be accessed by going to Menu, scrolling down to Labor, and selecting the report you wish to review.
Labor Analysis Report
This report is the most comprehensive report for analyzing schedule performance. This report compares the schedule saved in QSROnline to actual data collected from your POS system including Sales, Labor Hours, Labor $, and Labor %.
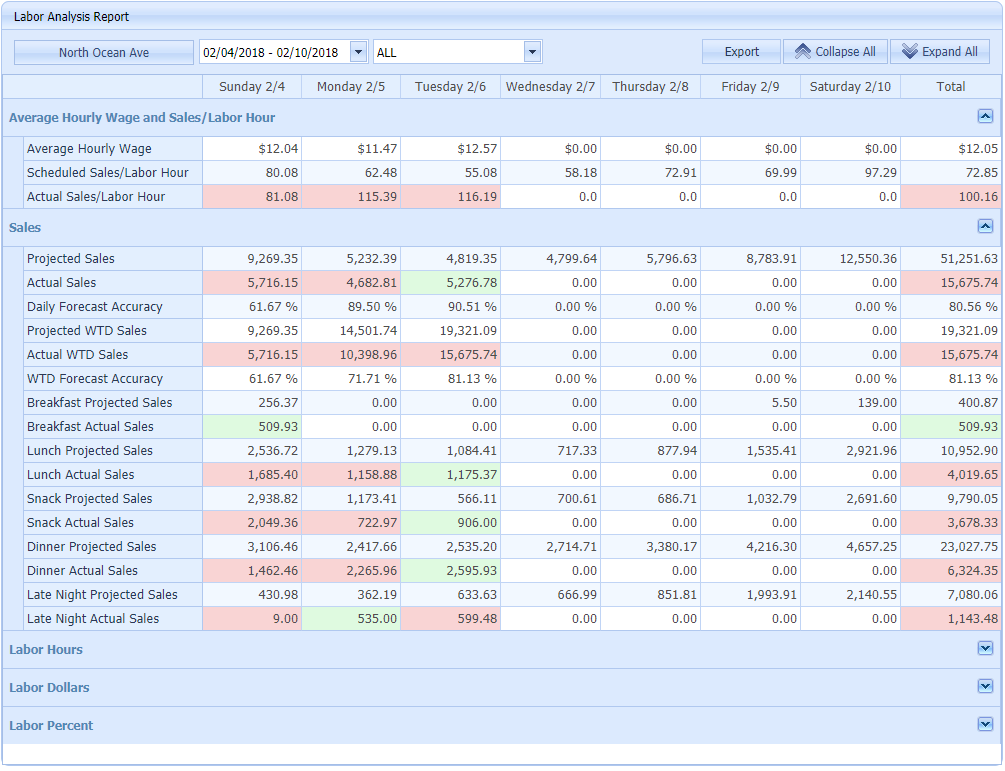
The red and green color coding makes it easy to identify how well each location is tracking throughout the week to answer questions like, “Are labor targets being met?”, “How accurate is my sales forecast in comparison to actual sales?”, and “Is labor being monitored throughout the day as needed?”.
The Labor Analysis Report compares your actual and projected sales to your actual and projected labor. Actual sales higher than those projected are depicted in green, actual sales less than projected are shown in red. The opposite is true for labor. Actual labor higher than projected is in red because higher labor hours result in a higher labor cost. Actual labor less than projected labor is in green because you are spending less on labor than expected.
The Daily Forecast Accuracy is based on how close the projected number is to actual sales. This number will always be less than 100% even if sales are greater.
Labor By Pay Period Report
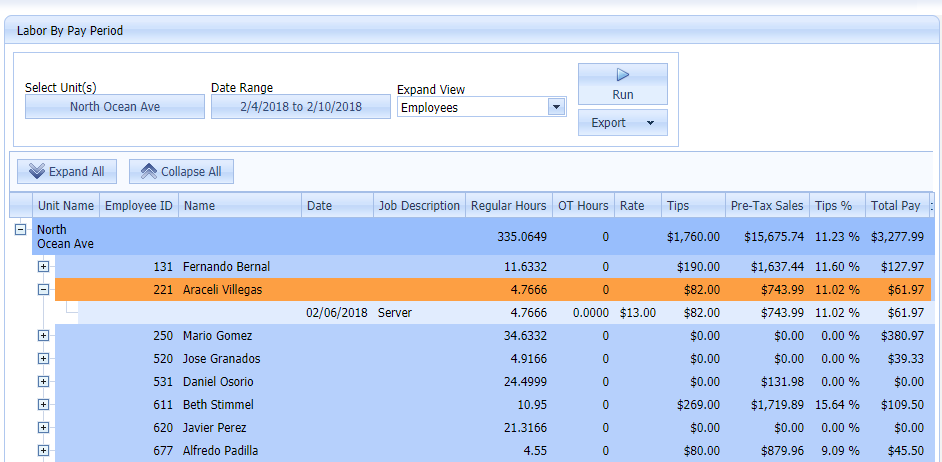
The Labor By Pay Period Report does just as its name suggests, detail employee payroll totals by pay period.
Select your Unit(s), Date Range, and click Run. Using the + button next to each employee, you can expand their profile to see their Regular Hours worked, OT Hours, Pay Rate, and Total Pay for the selected Date Range.
Clock In – Clock Out Report
The Clock In – Clock Out Report details actual clock in and out times for each employee. You can also use this report to see how many hours/minutes each employee has worked for the selected Date Range. This is a great tool for verifying payroll when away from the store.
Select your Unit(s), Date Range, and press Run. Using the + button next to each employee, you can expand their profile to see their Clock In Time, Clock Out Time, Total Minutes and Total Hours worked, along with their Job Description for the selected Date Range.

Clock-In Clock-Out Exceptions Report
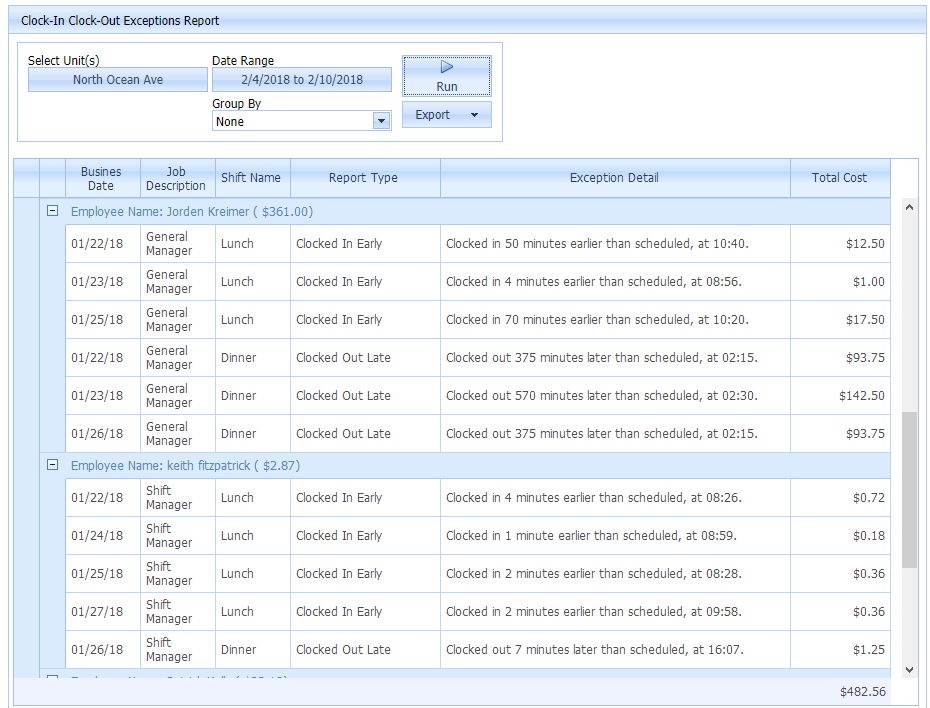
The Clock-In Clock-Out Exceptions Report details exceptions made to the schedule including:
- Early Clock In Times
- Late Clock Out Times
- No Shows
- Employees who Worked Unscheduled Shifts
Next, to each exception, you can see EXACTLY how much the exception added to your labor expense.
Select your Unit(s), Date Range, and Group By type of your preference. The example below left the default grouping option of None, but you can group this report by Date, Employee, or Unit. Press Run to generate the report.
Management Sales Coverage
This report is most commonly used to review how well a certain job code, such as a General Manager, is covering peak sales. This report compares the schedule saved in QSROnline to actual data collected from your POS system. In order for this report to report accurately, the partner must be scheduled with the same job code as they are clocking into the point of sale system.

Labor Audit
With the Labor Audit Report, you can view each time a schedule has been saved or posted. If you click the +, you can drill down to see additional details like if a shift was added, deleted, or replaced.

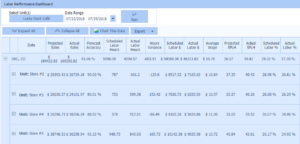
Labor Performance Dashboard
Here you can view similar schedule performance metrics as in the Labor Analysis Report, just in a more summarized view. If you have access to multiple stores, you can compare the metrics across the units.