QSROnline’s Web Scheduler automates the sales forecasting process for you, eliminating the guesswork! QSROnline collects historical sales from your POS system to project your upcoming sales You also have the ability to further adjust the sales that QSROnline has projected for you. Understanding your projected sales for an upcoming week helps ensure labor goals are met and that you schedule the right amount of employees according to expected sales volume.
Sales Projections
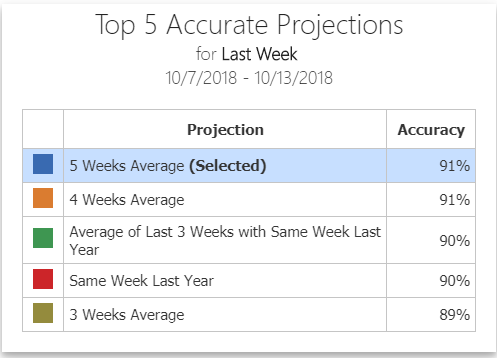
Sales Projections are automatically generated based on historical sales data collected from your POS system. QSROnline provides the Top 5 Accurate Projections for completed weeks. Each projection contains a percentage of accuracy that is calculated by comparing the Actual Sales to the Projected Sales for the selected completed week. Percentage of accuracy makes it easy to see which projection type most accurately predicted actual sales.
Default Projection Types
- Same Week Last Year:
- Last Week with Same Week Last Year:
- Average of Last 2 Weeks with Same Week Last Year:
- Average of Last 3 Weeks with Same Week Last Year:
- Average of Selected Weeks: [1-10] Weeks
Sales Forecast
In the Sales Forecast window, you will see references to sales projection as well as sales forecast. A sales projection uses historical sales, and applies a specific model/calculation to estimate sales for the selected week. The sales forecast includes any adjustments made to the original projection.
Once a sales projection type has been selected, adjustments can be made in any one of three different views before saving your Sales Forecast.
Forecast View
- Weekly
- Day Parts
- Hourly
Accessing Sales Forecast
Prior to building a new schedule, you will need to forecast your sales for the selected week. When selecting a new week in the Scheduler, the Sales Forecast window will appear on your screen. By default, the projection with the highest accuracy will be selected. You can easily change the selected Sales Projection using the drop down menu on the top left corner or clicking one in the top 5 accurate projections box.
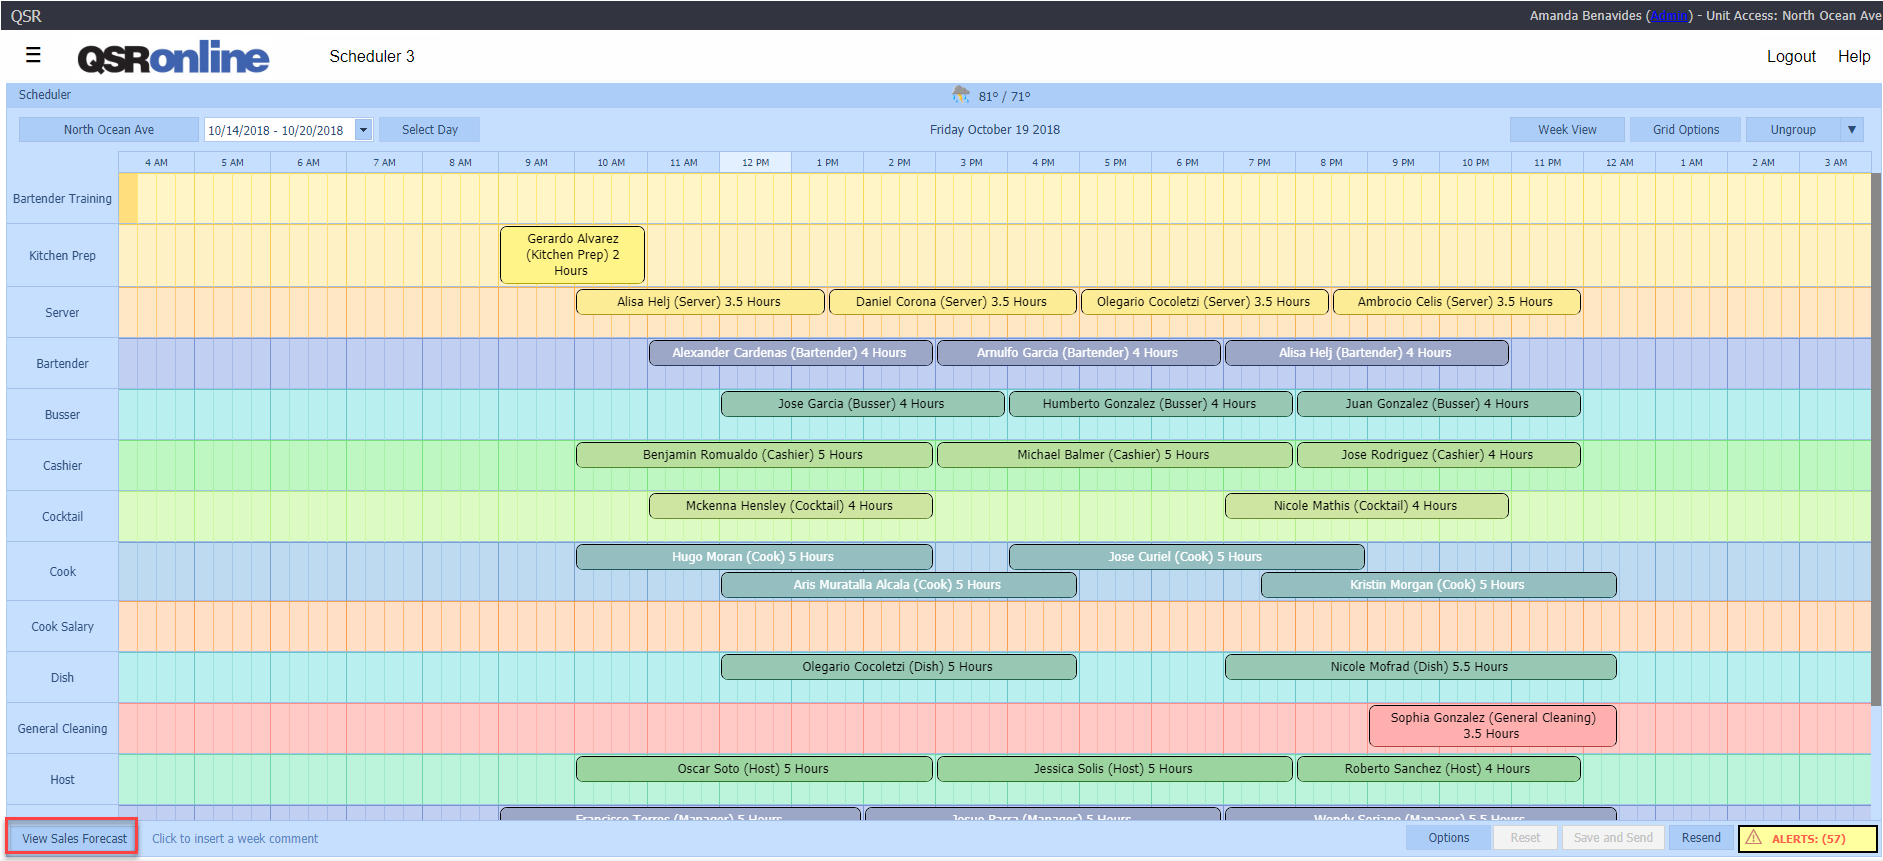
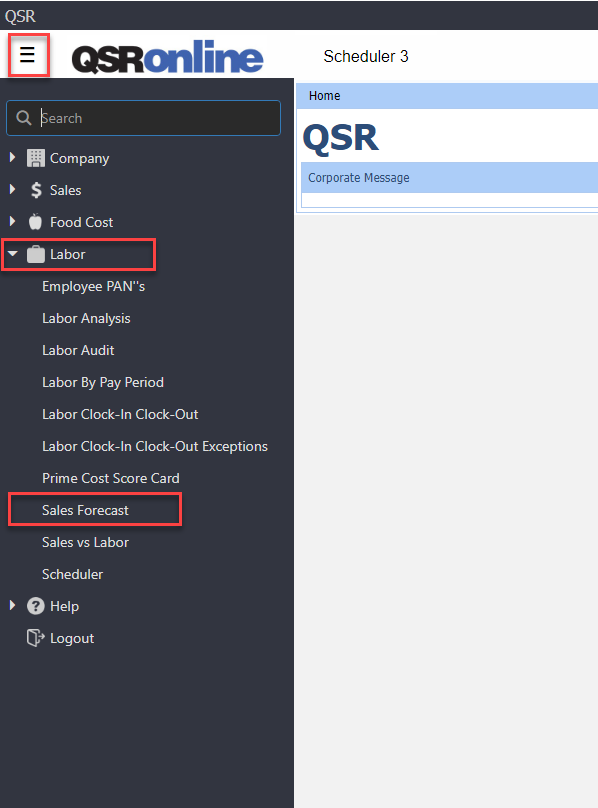
After the sales forecast for the selected week has been saved, you can access the Sales Forecast window by selecting the View Sales Forecast button on the bottom left corner of the Scheduler window or go to Menu, scroll down to “Labor” and select “Sales Forecast”.
When accessing the Sales Forecast within the Menu, users with access to multiple units will have the ability to switch between stores by using the Unit Picker on the top left corner.
Please note that once the schedule has been posted, the Sales Projection type selected cannot be changed for the given week. However, you will still be able to make manual adjustments to the projected sales for any day future date within the current week’s schedule. For example, if today is October 5th, you can add adjustments to the forecast for October 6th, 7th, and 8th (future dates), but you cannot add adjustments to previous dates, like October 3rd or 4th.
Forecast Editor
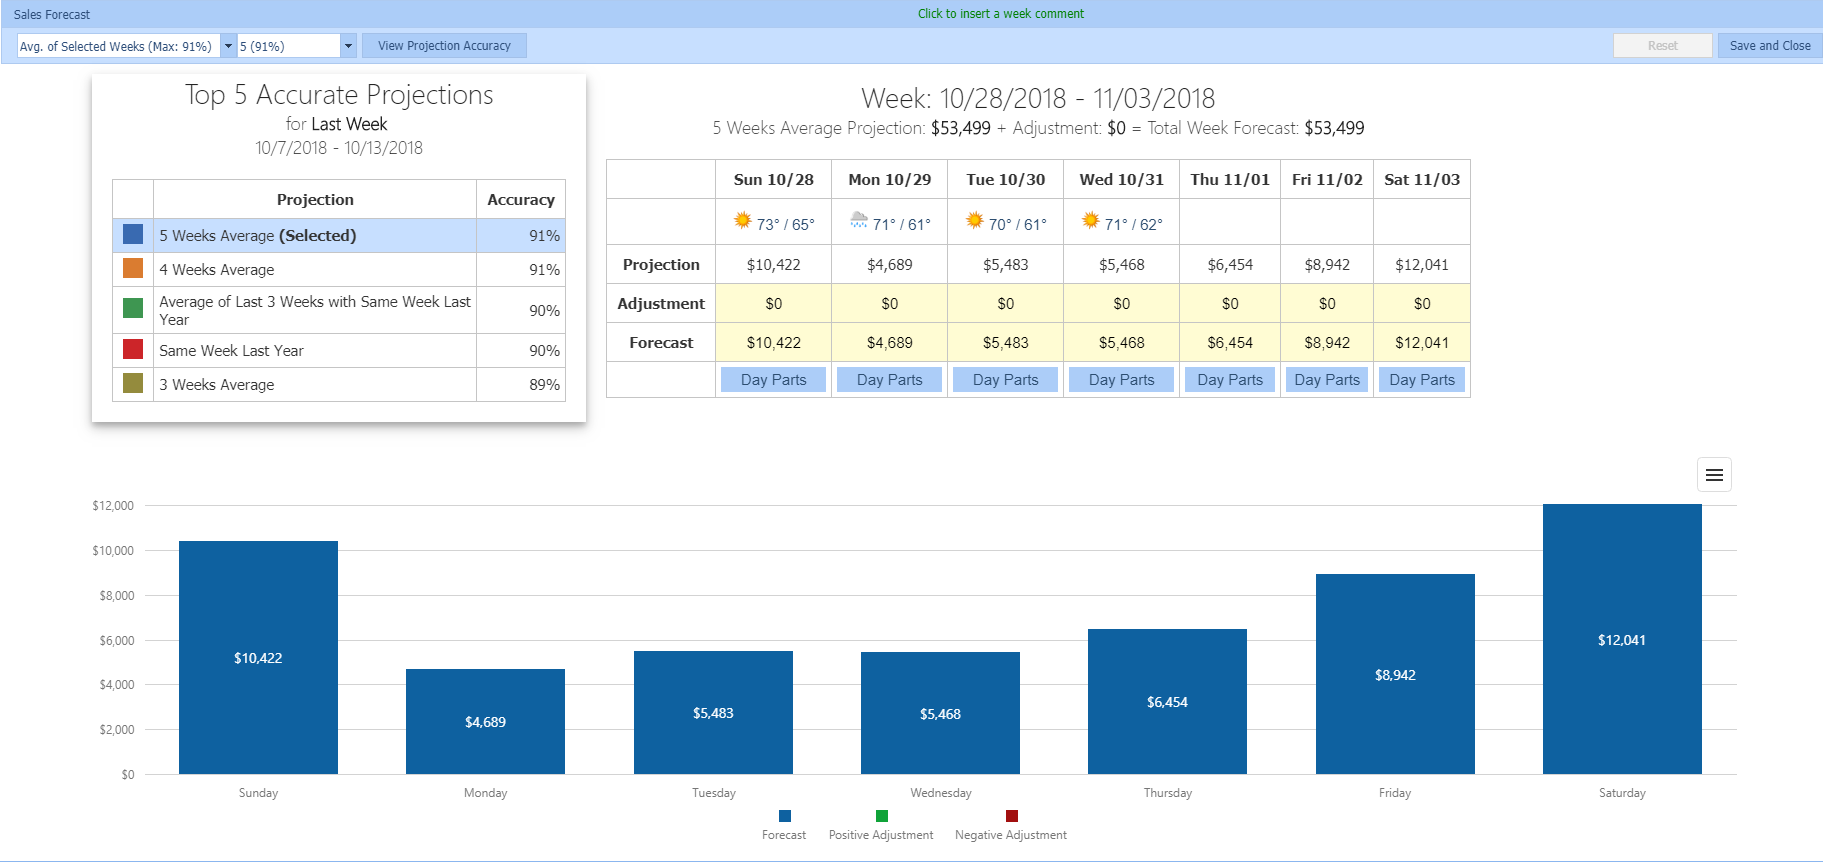
By default, the Sales Forecast opens up to the Forecast Editor page which displays the Top 5 Accurate Projections based on the last completed weeks sales data. The most accurate projection type will be selected for you by default. You can switch between the Top 5 Accurate Projections by using the drop down menu on the top left corner or by selecting another projection type in the box.
Once you have selected which projection type you would like to use, you will then begin making the necessary sales adjustments for the upcoming week at the Weekly, Day Part, and/or Hourly level. This allows you to remove or add sales to the selected Sales Projection if you expect lower or higher fluctuations in sales.
The bar graph will display the sales for the selected sales projection in blue. Any positive adjustments made to the projection will be displayed green and any negative adjustments will be displayed in red.
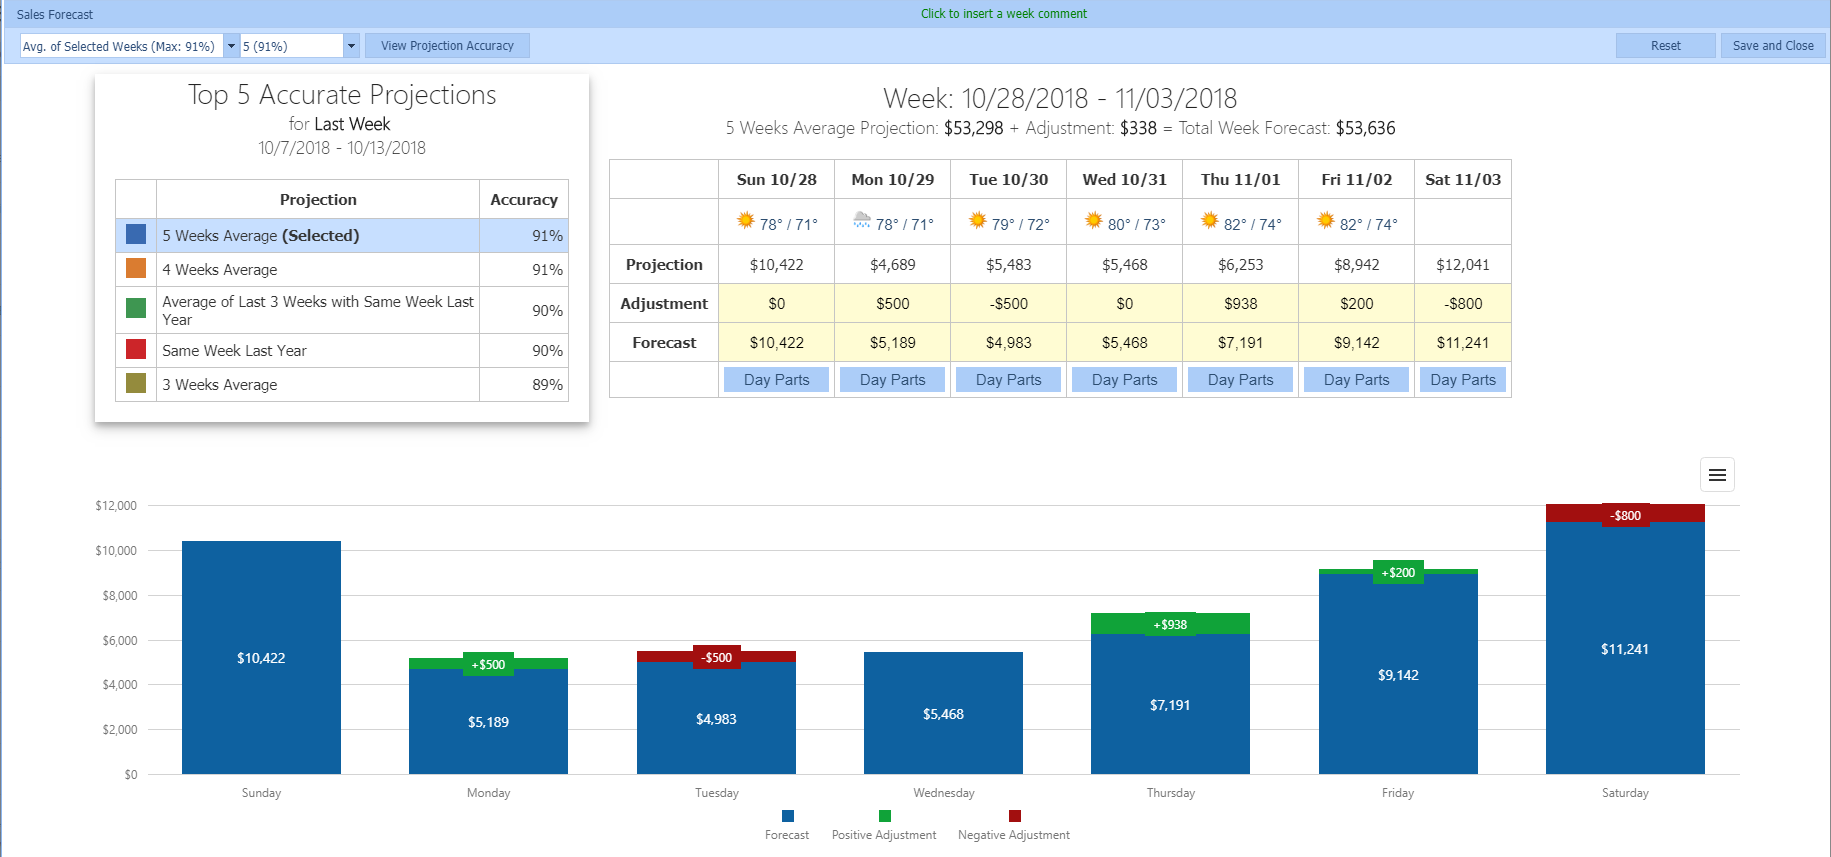
You can select to view the sales projection by hour by clicking an individual day displayed on the bar graph.
Weekly Forecast
The Weekly Forecast is the default view for the Sales Forecast. The Weekly Forecast allows you to make both positive and negative adjustments to daily sales projections.
Day Part Forecast
The Day Part Forecast breaks down sales for each individual day by day part (i.e. Breakfast, Lunch and Dinner). Day Parts allows you to make adjustments that are spread evenly across the selected day part.
Please note that the day parts descriptions and time frames are set during your onboarding process and are company specific. Since day parts are company specific, they cannot be customized per store.
Hourly Forecast
The Hourly Forecast breaks down sales for each day by hour. The Hourly Forecast allows you to make adjustments to sales projections for selected hours.
Please note that by default, the Hourly Forecast will only show hours that have sales for the selected sales projection. To add hours for opening and closing (when no sales are recorded), click the plus sign at the beginning or end of the hourly table.
View Projection Accuracy
The View Projection Accuracy Page will default to the last completed week when building a new schedule. You can switch the date range to view historic projection accuracy using the drop down menu on the top left.
Please note that the date picker will only populate a list of completed weeks.
Top 5 Accurate Projections
This table will display the Top 5 Accurate Projections for the selected week. By default, the most accurate projection for the week will always be selected. You can click each projection in the table to view the Sales Projection Accuracy for each day in the bar graph to the right.
Double clicking a Sales Projection in the table will display a comparison of the Top 5 Accurate Sales Projections in the all Sales Projection Accuracy bar graph to the right.
Sales Projection Accuracy
By Default, the Sales Projection Accuracy bar graph displays accuracy by %. Selecting the % icon on the top left corner of the Sales Projection Accuracy graph will allow you to switch axis to display sales dollars. When switching the Sales Projection Accuracy bar graph to dollars ($), the bar graph will display the projected vs actual sales for each day during the selected week.
The Bar Graph legend will display the colors used in the bar graph for each of the Top 5 Accurate Projections.
Hourly Projected Sales vs Actual Sales
The line graph on the bottom of the screen will display the Hourly Projected Sales vs the Actual Sales for the first day of the business week for the selected Sales Projection by default. You can switch between days by clicking a different day within the Sales Projection Accuracy bar graph above.
Please note that the Actual Sales will always be displayed in purple on both the bar and line graphs.